Case study · FHWien der WKW · Master’s in Digital Technology & Innovation
How do you want to live?
One place, one perspective, one answer: the Living Score of Vienna Living Map, rebuilt with Python, Flask and SQLite. Pick one of the 122 places below. The card calculates instantly, with the same engine as the prototype.
A prototype from the course Agile Software Engineering, built by Lucas Jakubeit, who develops Vienna Living Map and Azima.
Perspective
Set your own weights
Loading the card …
↓ the answer is made in the engines ↓
↑ fed by the foundation ↑
listed on data.gv.at
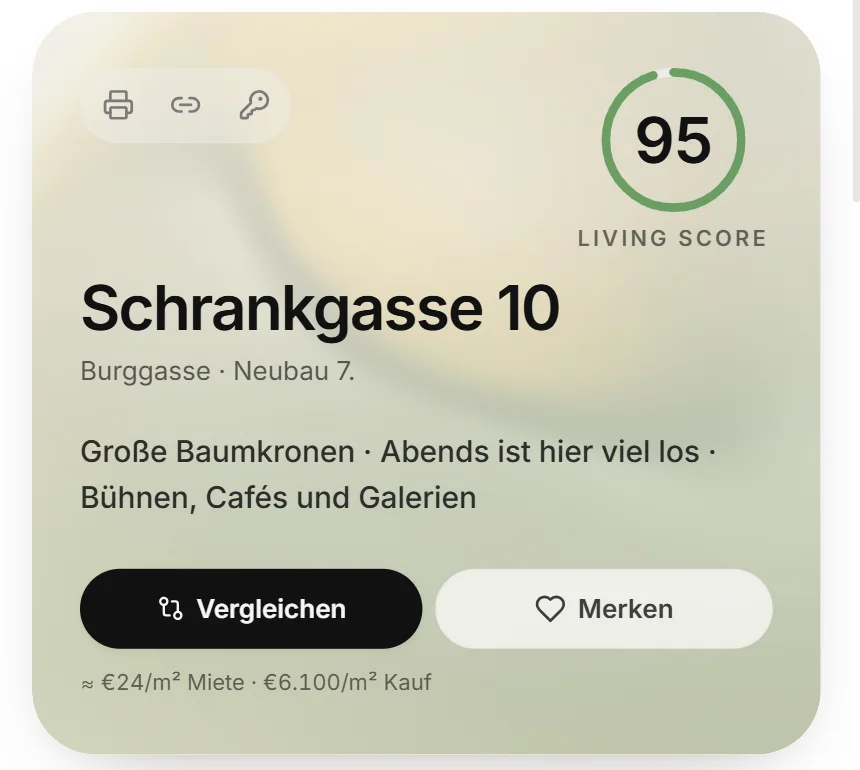
Vienna Living Map · Schrankgasse 10 · captured on 2 October 2026
Fingerprint · Schrankgasse 10
Calculated with the Vienna Living Map atmosphere engine, 0 to 100 per axis
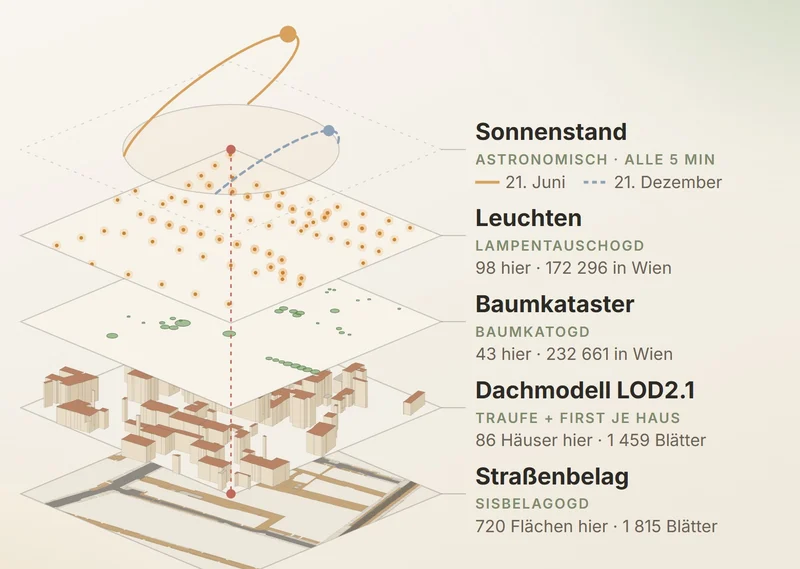
Prototype: eight values per place, each with its source. Product: 220 × 220 m around Schrankgasse 10, every layer drawn from the file the app loads.
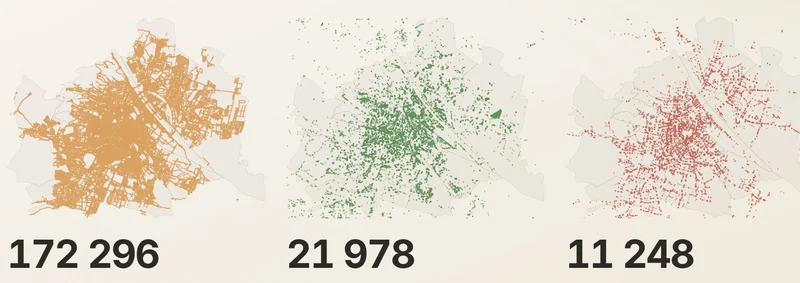
City of Vienna open data (lights), CC BY 4.0 · OpenStreetMap (benches, crossings), ODbL
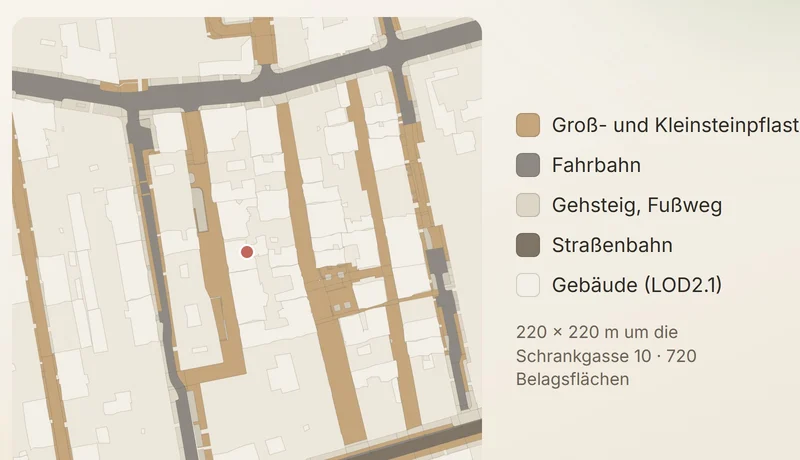
City of Vienna street information system (SISBELAGOGD) · 720 surface areas in 220 × 220 m
- Collect · open sources~15 build scripts and monthly cron jobs pull City of Vienna OGD, OpenStreetMap, Wiener Linien, GeoSphere and Statistics Austria.
- Calculate · deterministic engineDimensions are weighted per perspective, the same formula for address, Grätzl and district, frozen by golden tests.
- Translate · AI only as languageWishes become weights, facts become prose. Never rankings. A gate rejects clichés.
- Check · after every deployGolden tests, number check, voice QA across all texts, live smoke test, weekly image audit.
Family
Spittelberg · For most people
Σ (value × weight) ÷ Σ weight × 10
Spittelberg
✓ Strongest
ⓘ The trade-off
Only layers that matter to the chosen perspective count (weight from 8 %). What it does not care about can never be its trade-off.
-- api.py · load_place(): the place with its district
SELECT p.*, b.name AS bezirk_name,
       b.miete_qm, b.kaufpreis_qm
FROM place p
JOIN bezirk b ON b.nr = p.bezirk_nr
WHERE p.id = ?;

-- load_weights(): the weights of the perspective
SELECT dimension, weight
FROM persona_weight
WHERE persona_key = 'default';

-- ranking(): all Grätzl, sorted in Python
SELECT p.*, b.name AS bezirk_name
FROM place p JOIN bezirk b ON b.nr = p.bezirk_nr
WHERE p.kind = 'graetzl';
# engine.py · testable without Flask or a database
def living_score(values, weights):
    used = {d: w for d, w in weights.items()
            if w > 0 and d in values}
    total = sum(used.values())
    if total == 0:
        raise ValueError("Mindestens ein Gewicht > 0")
    return round(sum(values[d] * w
        for d, w in used.items()) / total * 10, 1)

def tradeoff(values, weights):
    # the weakest layer that matters to
    # THIS perspective (weight ≥ 8 %)
    relevant = [(values[d], d) for d, w
                in weights.items() if w >= 0.08]
    return min(relevant)[1] if relevant else None
name
miete_qm
kaufpreis_qm
kind · name
bezirk_nr FK → bezirk
lat · lng
8 values, 0 to 10
label
dimension
weight ≥ 0
schema.sql · one district has many places, one perspective many weights
16 tests · every push, every pull request
on:
  push:
  pull_request:
jobs:
  tests:
    runs-on: python
    steps:
      - name: clone repo
        run: git clone "https://ci:${{ forgejo.token }}@…" .
      - name: checkout commit
        run: git checkout ${{ forgejo.sha }}
      - name: install dependencies
        run: pip install -r requirements.txt
      - name: run tests
        run: python -m unittest discover -s tests -v
- prebuild syntax check over 177 files the compiler does not see
- build
tsc -b && vite build, over 750 pages are pre-rendered - test golden tests · number check against the dataset · banned-words gate over every generated text
- push = deploy Cloudflare Pages builds from
main - after deploy live smoke test against the real domain
- monthly cron jobs refresh Vienna OGD, OSM, GeoSphere
- weekly self-healing image audit
| Sprint 0 | until 7 Nov · roles, repo, runs locally for everyone |
| Sprint 1 | 7–21 Nov · everyone ships one feature via pull request |
| Sprint 2 | 21 Nov–5 Dec · frontend, tests, first live version |
| Sprint 3 | 5–19 Dec · stabilise, accessibility, docs |
| Sprint 4 | 19 Dec–9 Jan · feature freeze, presentation |
| Due | 15 Jan · main tagged · presentation 16 Jan |
Definition of Done
- Pull request with reviewa second person reads, runs it locally, merges
- Tests greenlocally and in CI, red is never merged
- Docs updatedREADME or wiki when usage changes
- Changelog with AI sharename and GenAI share in percent per entry
- Checked on a phonewhen the frontend is affected
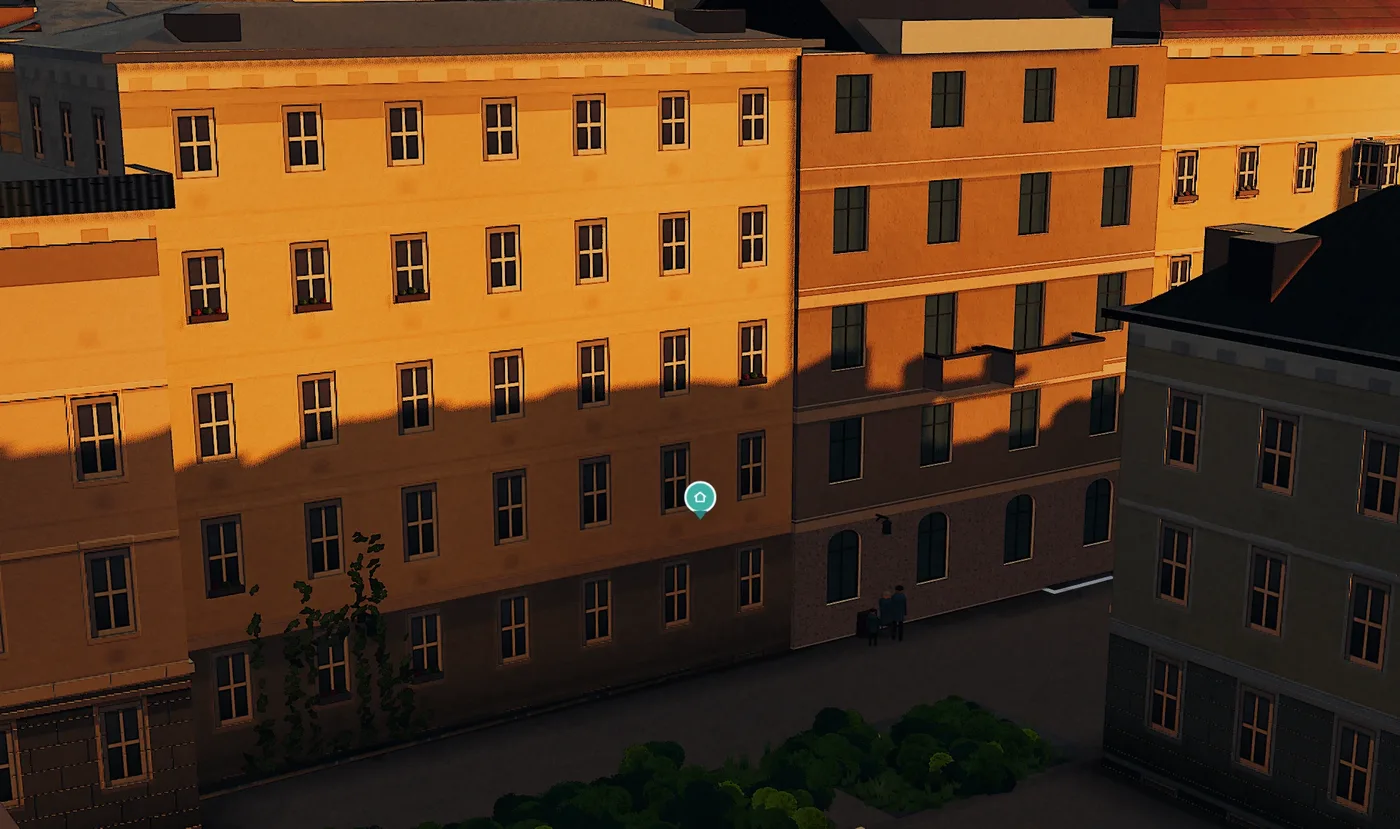
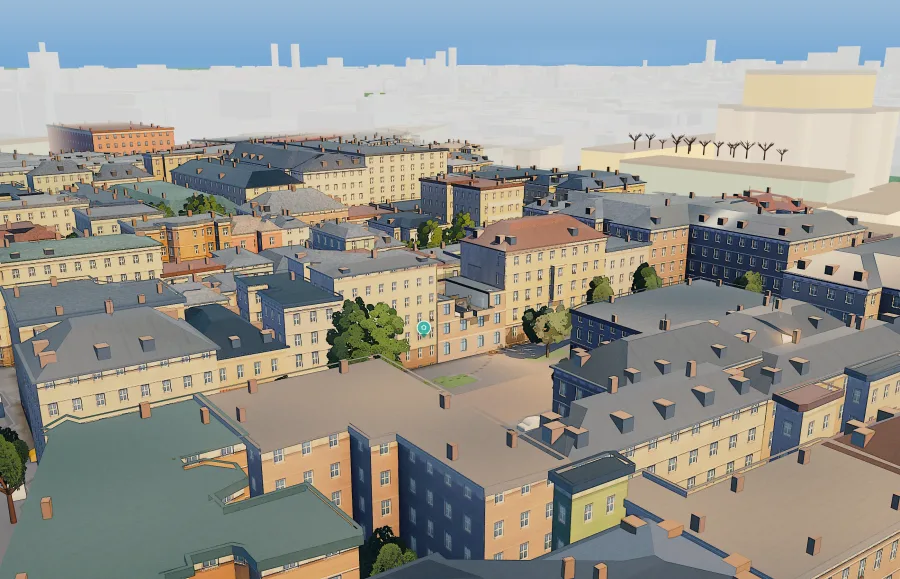
21 December, 2 pmThe building opposite draws the line. Whoever lives above it gets winter sun.
Azima stage · Schrankgasse 10, Vienna-Neubau
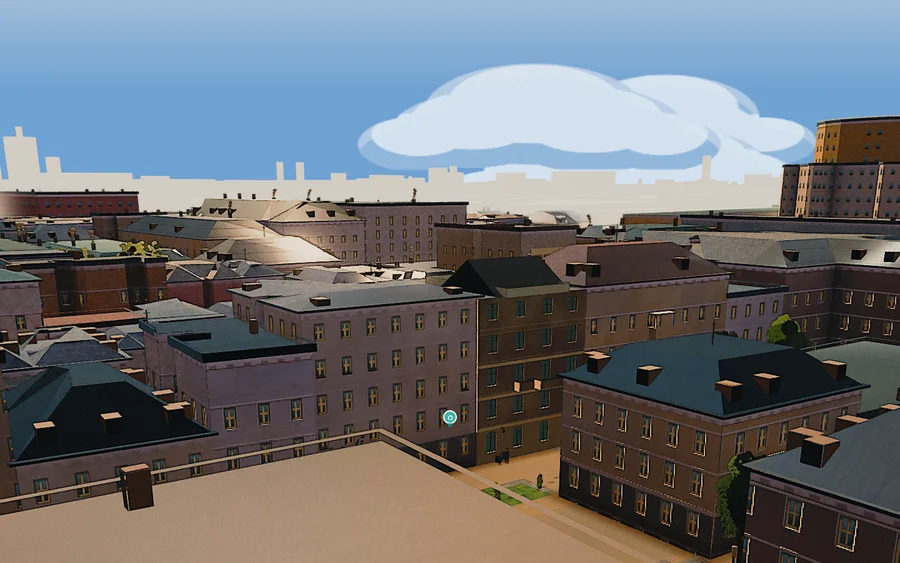
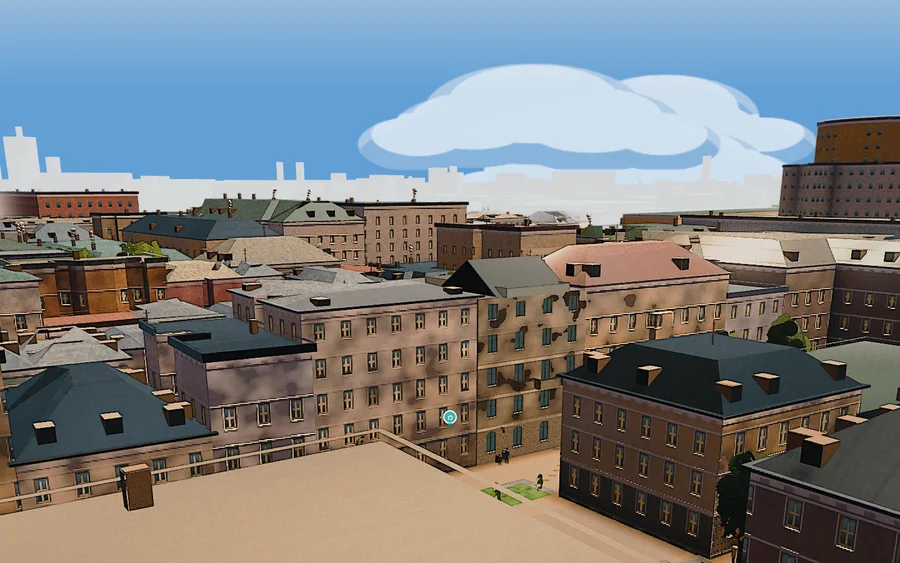
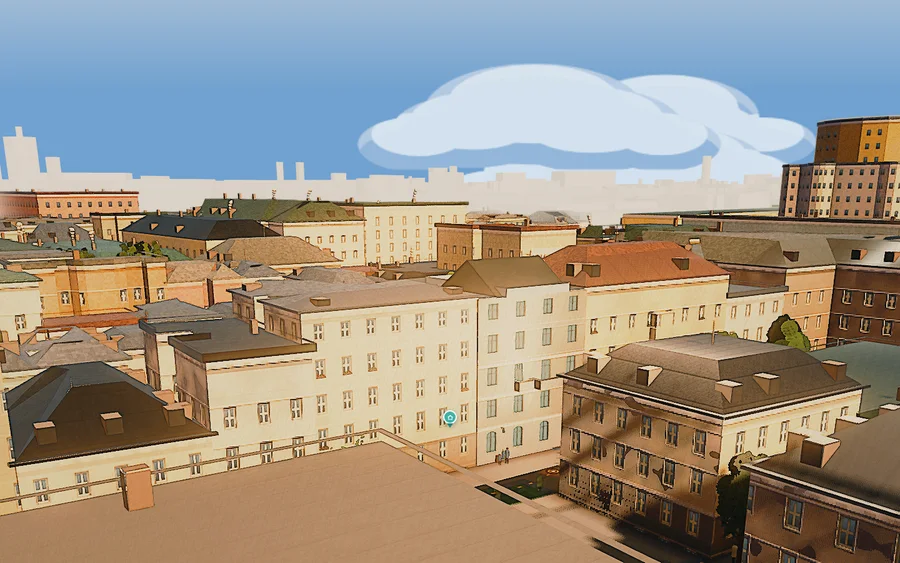
Azima stage · measured neighbour heights, astronomical sun position
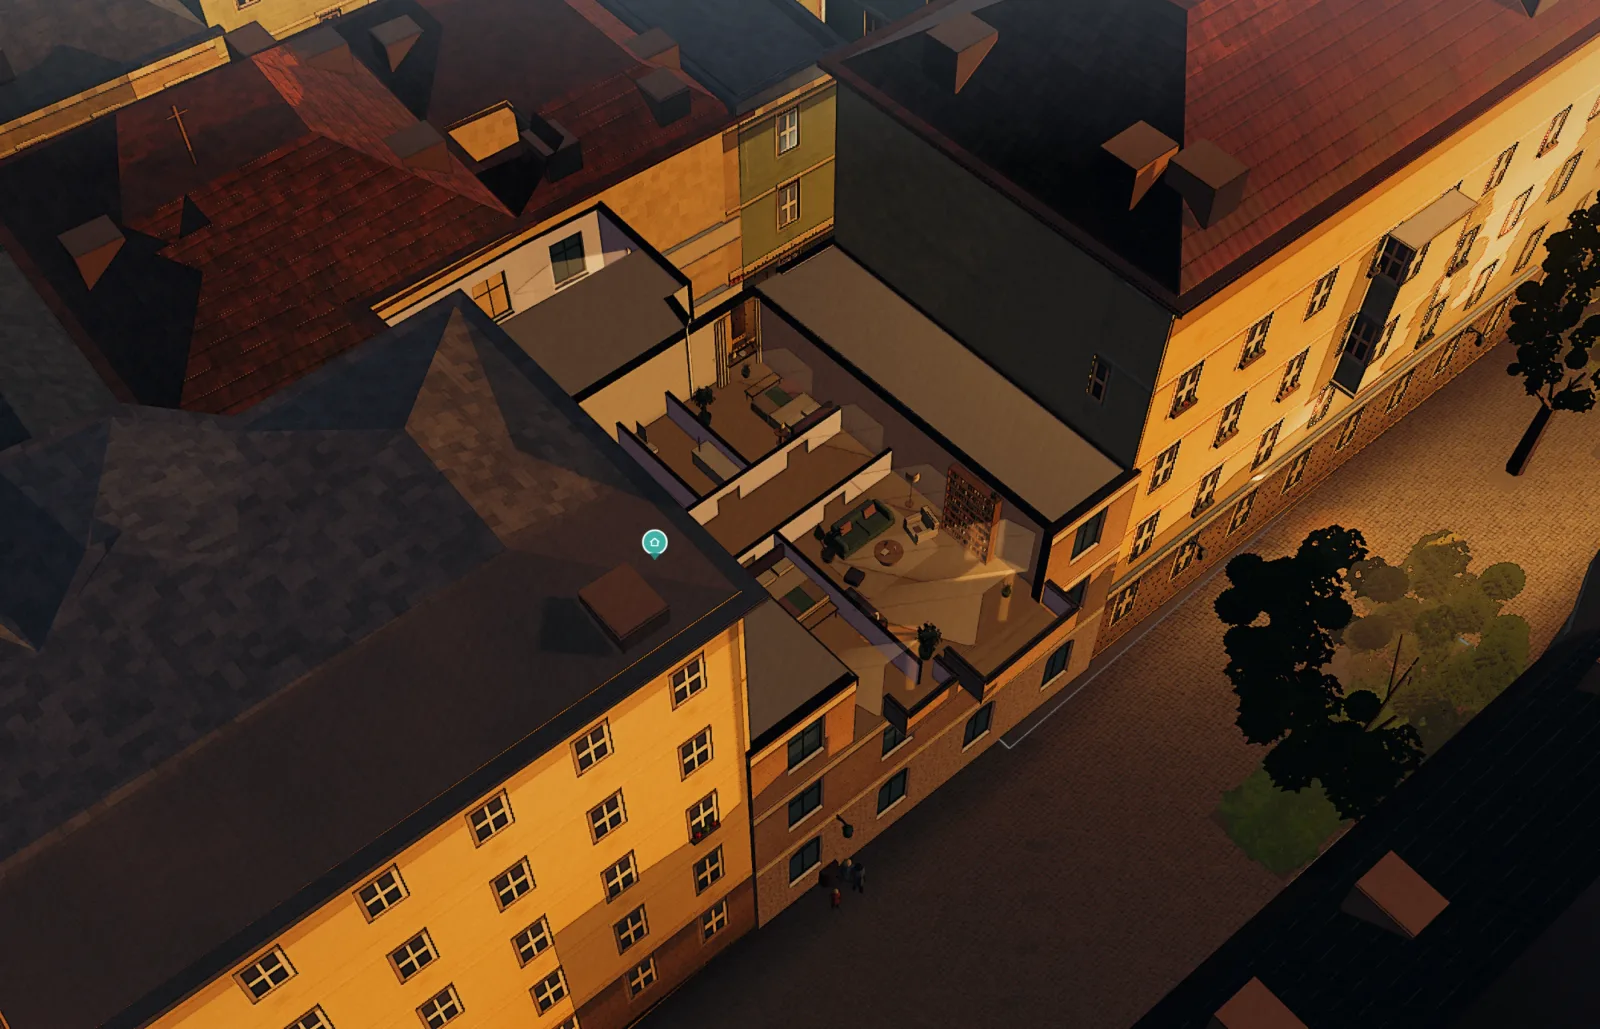
The same minute, inside the roomSun maps stop at the outer wall. Azima keeps going: through the window, down to the floor.
Azima stage · floor plan from the listing
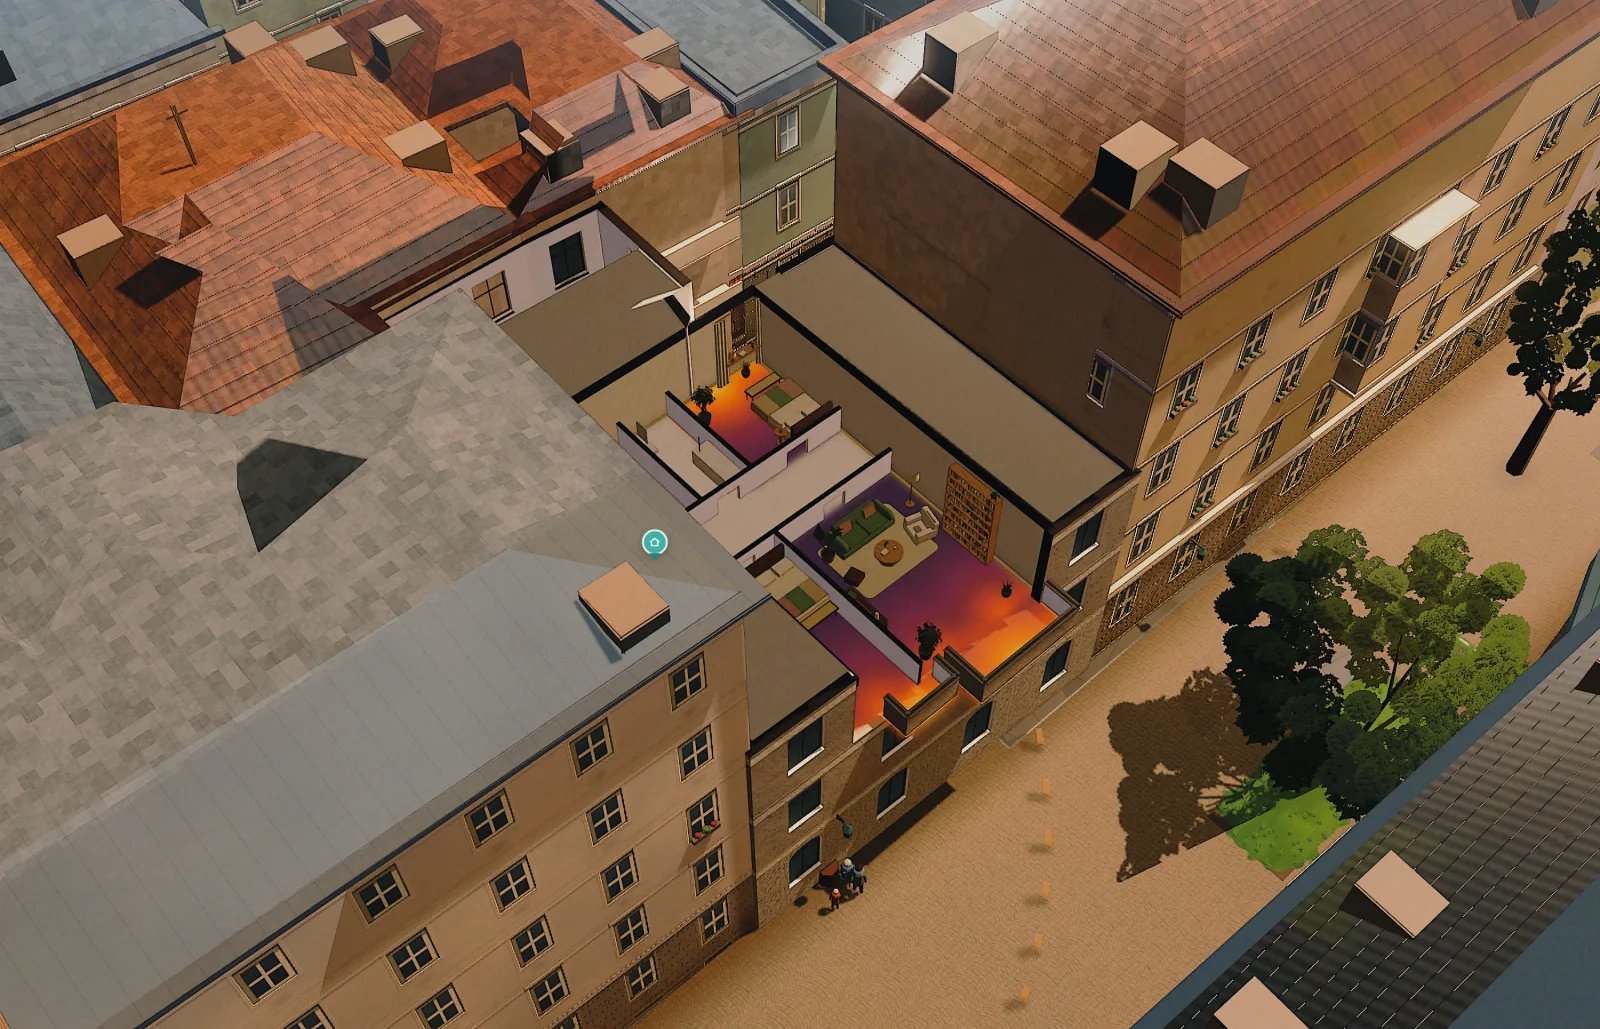
21 June, 1:05 pmSun load per m² of floor, calculated on your own device’s graphics card. The floor plan never leaves it.
relative to the sunniest room, not a temperature
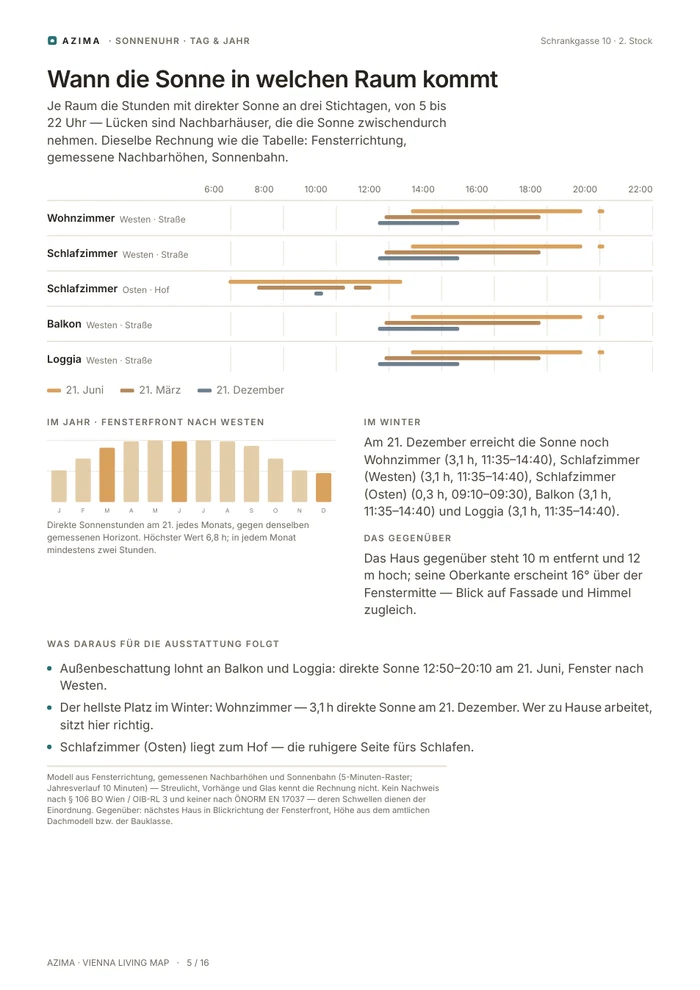
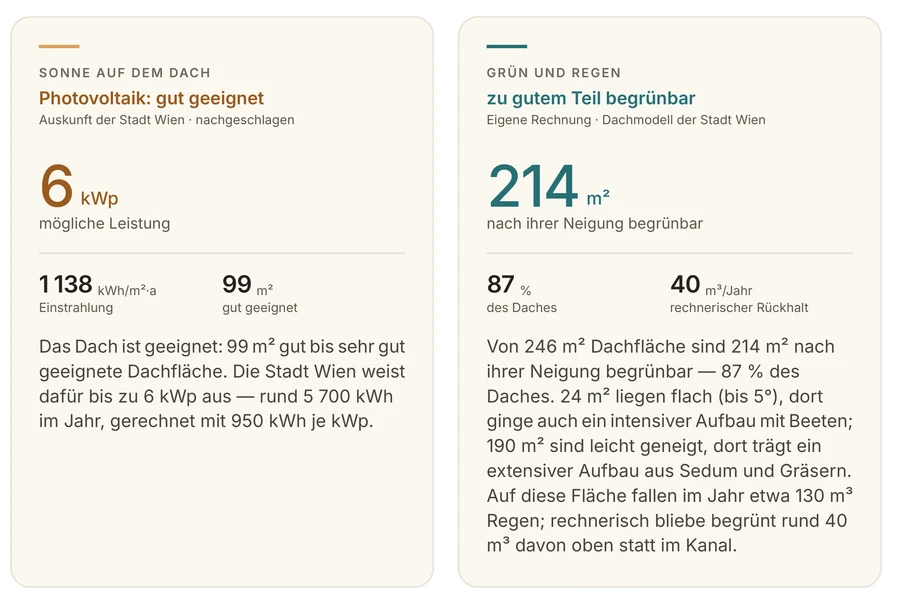
Azima report as PDF · Schrankgasse 10 · 16 pages
| Feature | Prototype (FH) | Vienna Living Map · Azima |
|---|---|---|
| Places | 122 (districts + Grätzl) | every address in Vienna |
| Layers | 8 values per place | score dimensions, 8 atmosphere axes, 13 topics: light, noise, heat, trees, green roof, zoning |
| Calculation | weighted mean | engine, astronomical sun, obstruction horizon from the LOD2 roof model |
| Card | ring, verdict, dimensions, trade-off | plus essence, character image, story, light with 3D vignette |
| Rendering | HTML, CLI | MapLibre GL and Three.js on one stage |
| Data | 1 seed file | ~43,000 points, own vector tiles |
| Stack | Python · Flask · SQLite | TypeScript · React · Cloudflare · PWA |
- The AI never invents.It translates. Ranking is deterministic, a gate rejects clichés.
- Every strength has a trade-off.No place is described as perfect.
- A missing sense is named.Summer heat is “modelled, not a measured temperature”.
- A measured downside stays.Aircraft noise, shade, heat are explained better, never hidden.
- No scraped prices, no invented images.Indexed district medians; real photos, only style-transferred and checked.
- Private without compromise.No account, no cookies; the floor plan never leaves the device.
The idea
Flat hunting starts the wrong way round
With a listing, a district cliché or a map full of pins. What is missing is the step before: how do I actually want to live? People don’t think in “transit = 0.4”. They think in wishes.
The concept
Not just where you live. But how.
Vienna Living Map translates wishes into data and the data back into language. At the front is what you use. In the middle, the engines work. Underneath lies the foundation: data, cron jobs, checks.
Explained · emotion in, places outEmotion is the input, places are the output, data is the truth. The AI never invents a score. Where data is missing, VLM says so. The prototype rebuilds exactly the middle column: the score engine.
Where it comes from
Vienna Living Map
A free housing compass for Vienna: it shows not only where things are but what it is like to live there. All from open data, no account, no cookies, listed as an official open-data application on data.gv.at.
The score card · Schrankgasse 10
95, and three sentences instead of metrics
This is the product the prototype rebuilds. At the top the ring, below it the essence in three observations: how the space feels, the rhythm of the day, what makes this place. The price sits as a quiet line below.
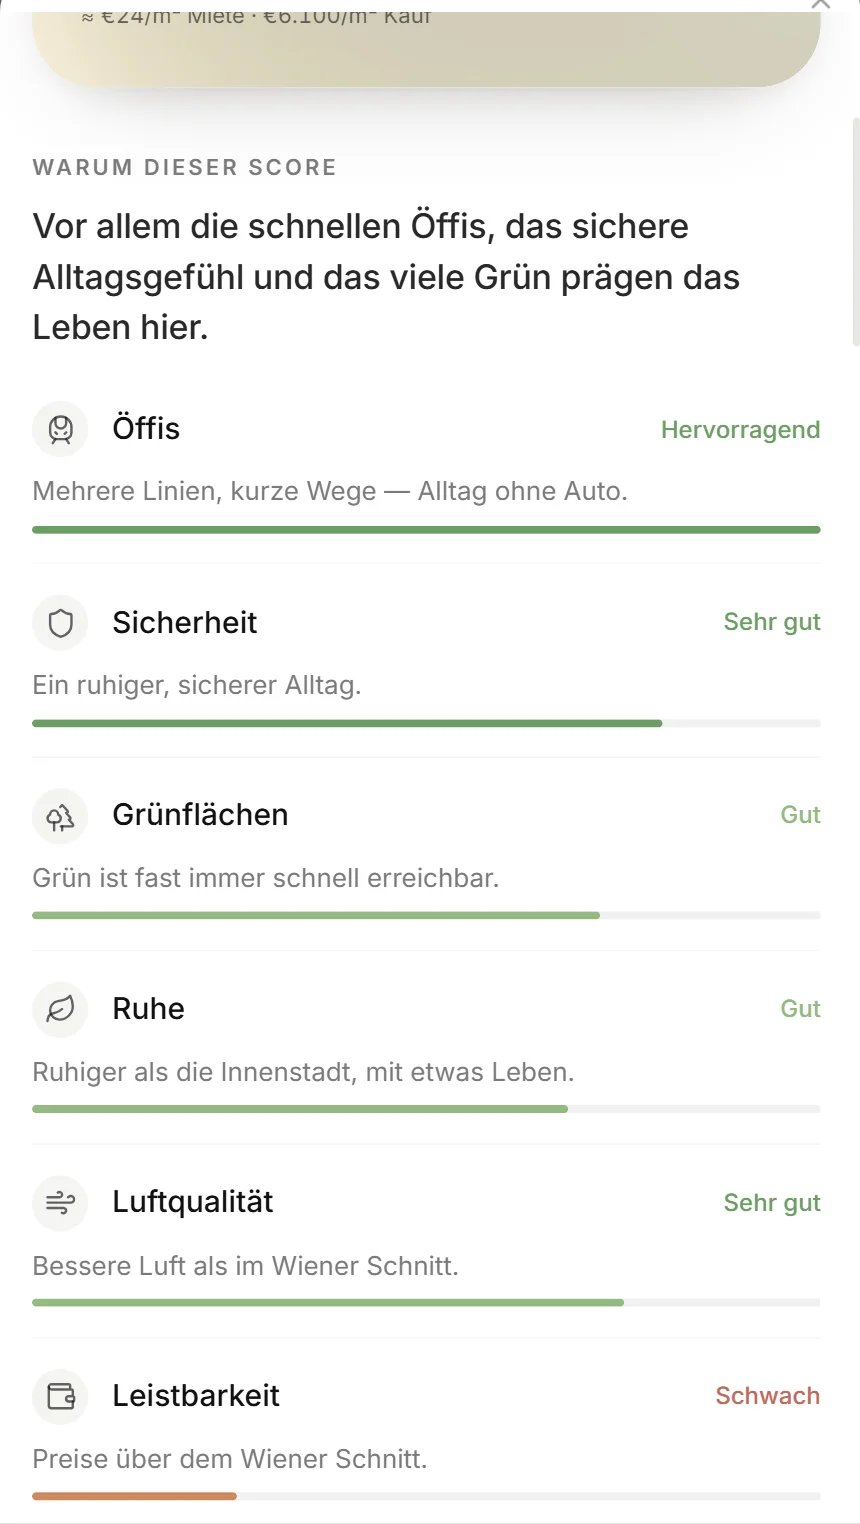
Why this score
Every number has a reason
One sentence names what carries the number. Below it, every dimension with a level, an everyday sentence and a bar. Never the formula, never a decimal.
Explained · what the prototype takes overThe live card at the very top has exactly this structure, with the same sentences. What is missing needs data a seed file does not have: essence, character, light, the 13 topics.
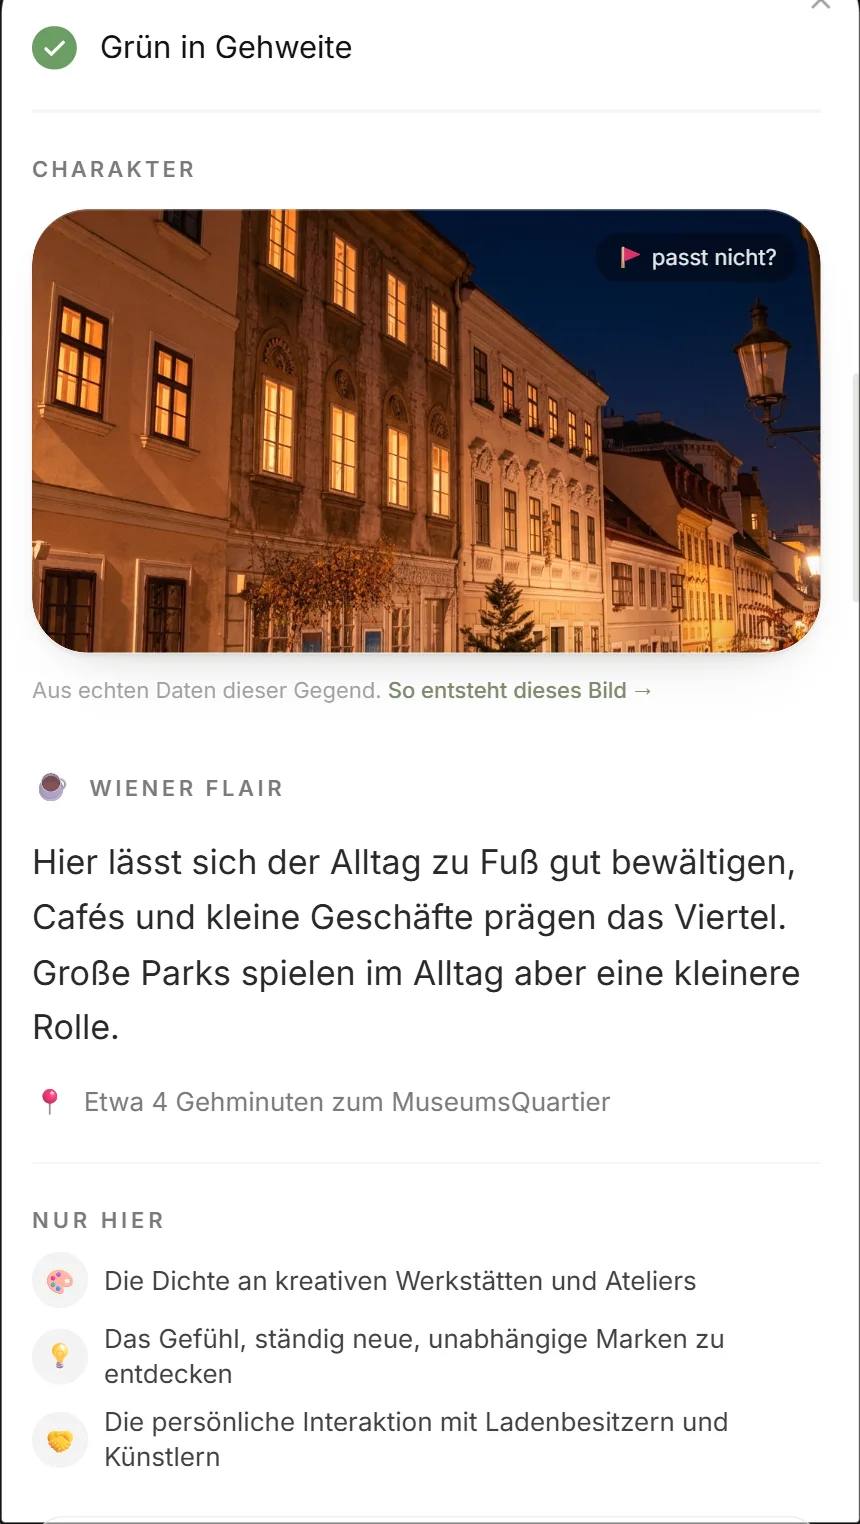
Character & Viennese flair
A real photo, never an invented Vienna
The image is a freely licensed photo of the area, only style-transferred. An image check rejects logical breaks. Below it the place story with an honest trade-off and “Only here”.
Atmosphere as data
Every place has a fingerprint
Eight axes, like Spotify audio features, only for places. A profile instead of a category: Schrankgasse is mostly culture & cafés and rhythm, with surprisingly much green, and hardly any water.
Explained · personality, not scoreThe fingerprint never enters the formula. It colours stories, images and motion so that Grinzing sounds different from Neubau. A value without good or bad.
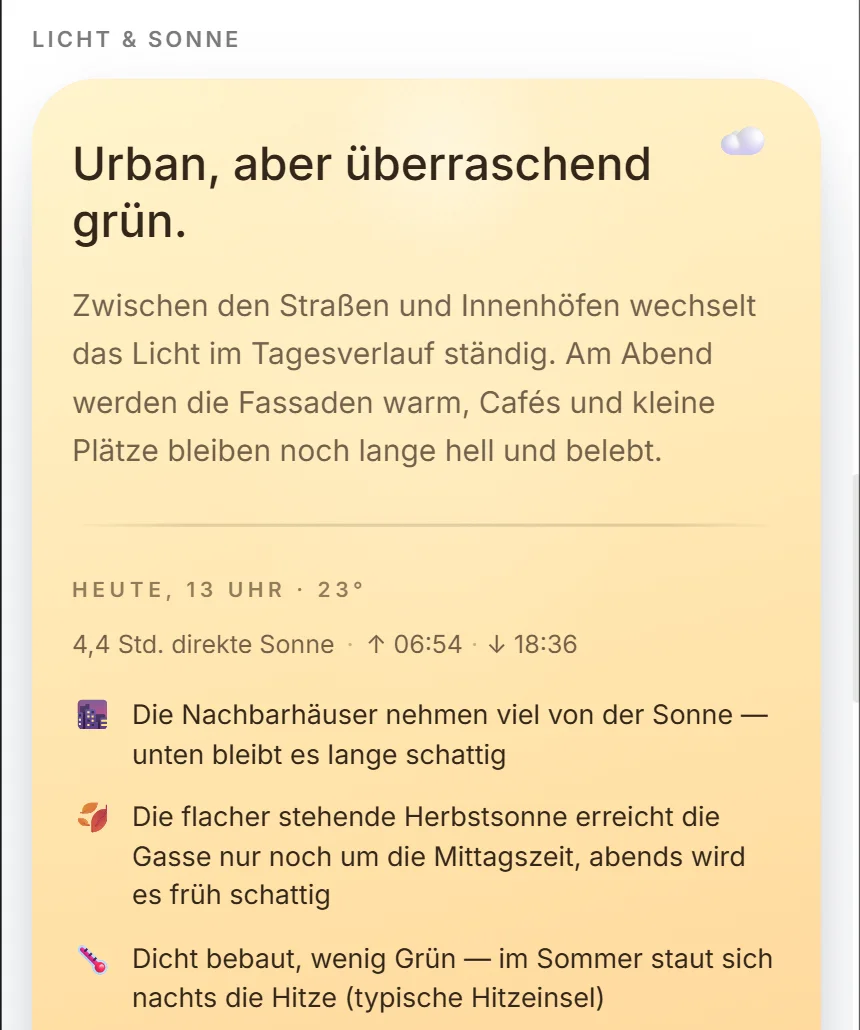
Light & sun
The card is the sky of this minute
Deep blue at night, warm at noon. Below it measured sentences about neighbours, autumn sun and heat. Sun is never a score, it is an experience.
The sun vignette
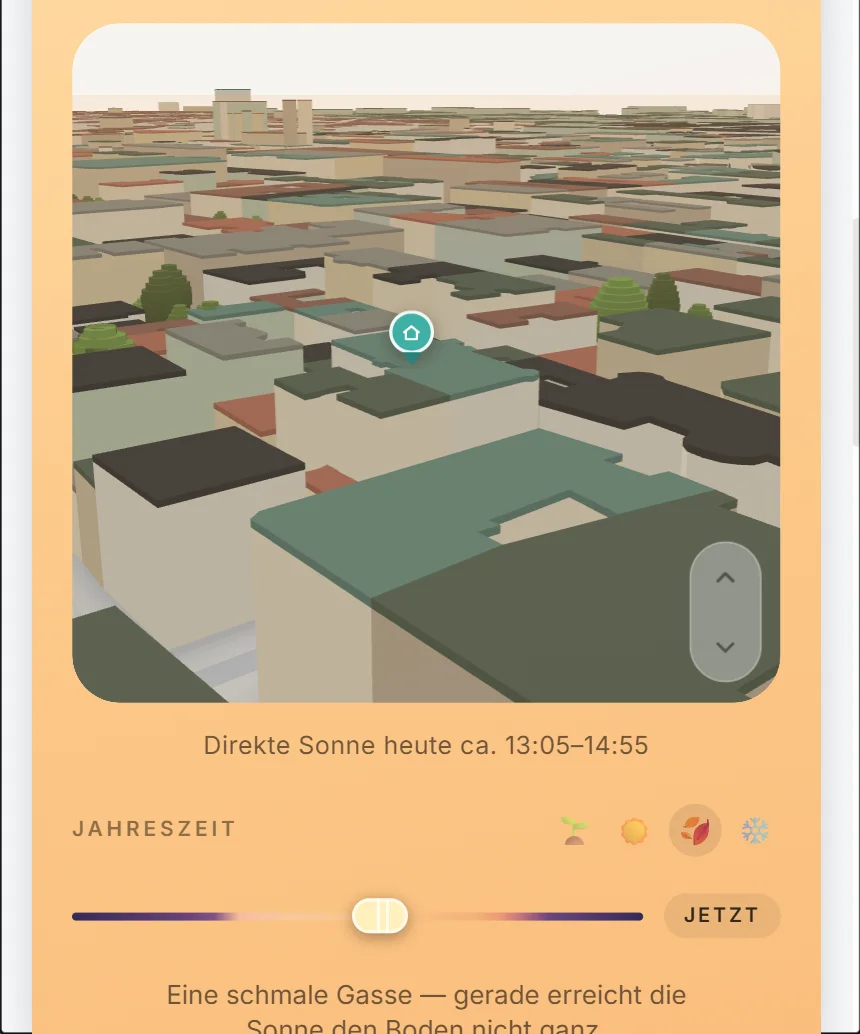
The real surroundings, in 3D
Building heights from the city’s roof model, trees from the tree register, the own building marked. A slider moves the sun through the day, the shadows follow. Below it the sun window: direct sun today approx. 13:05 to 14:55.
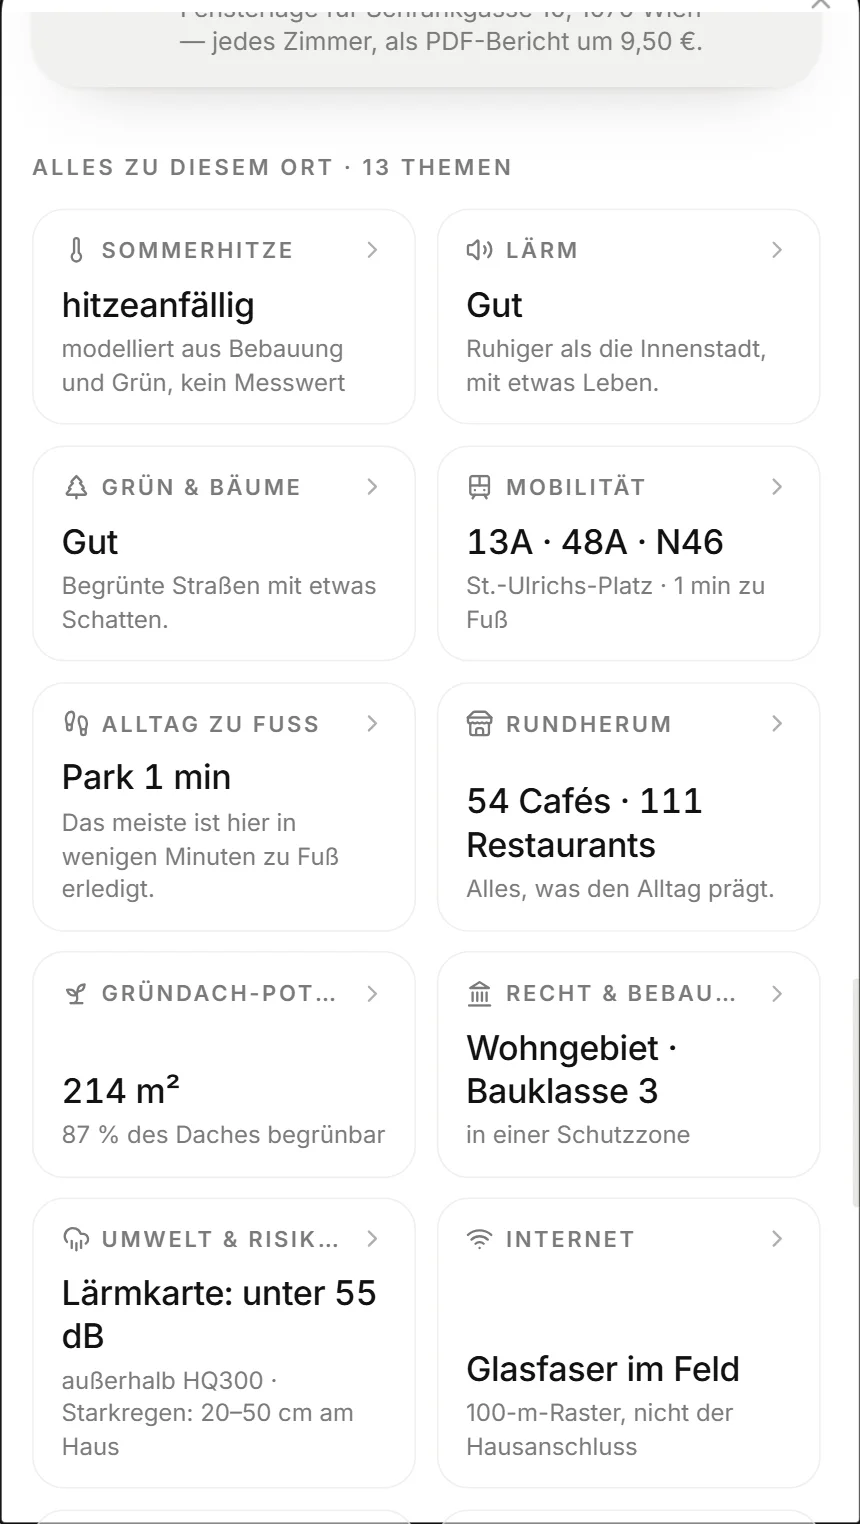
Everything about this place
13 topics, every tile with a source
Summer heat, noise, green & trees, transit, everyday walks, surroundings, green-roof potential, zoning, environment & risks, broadband, the year, housing market, more places. What is modelled says so.
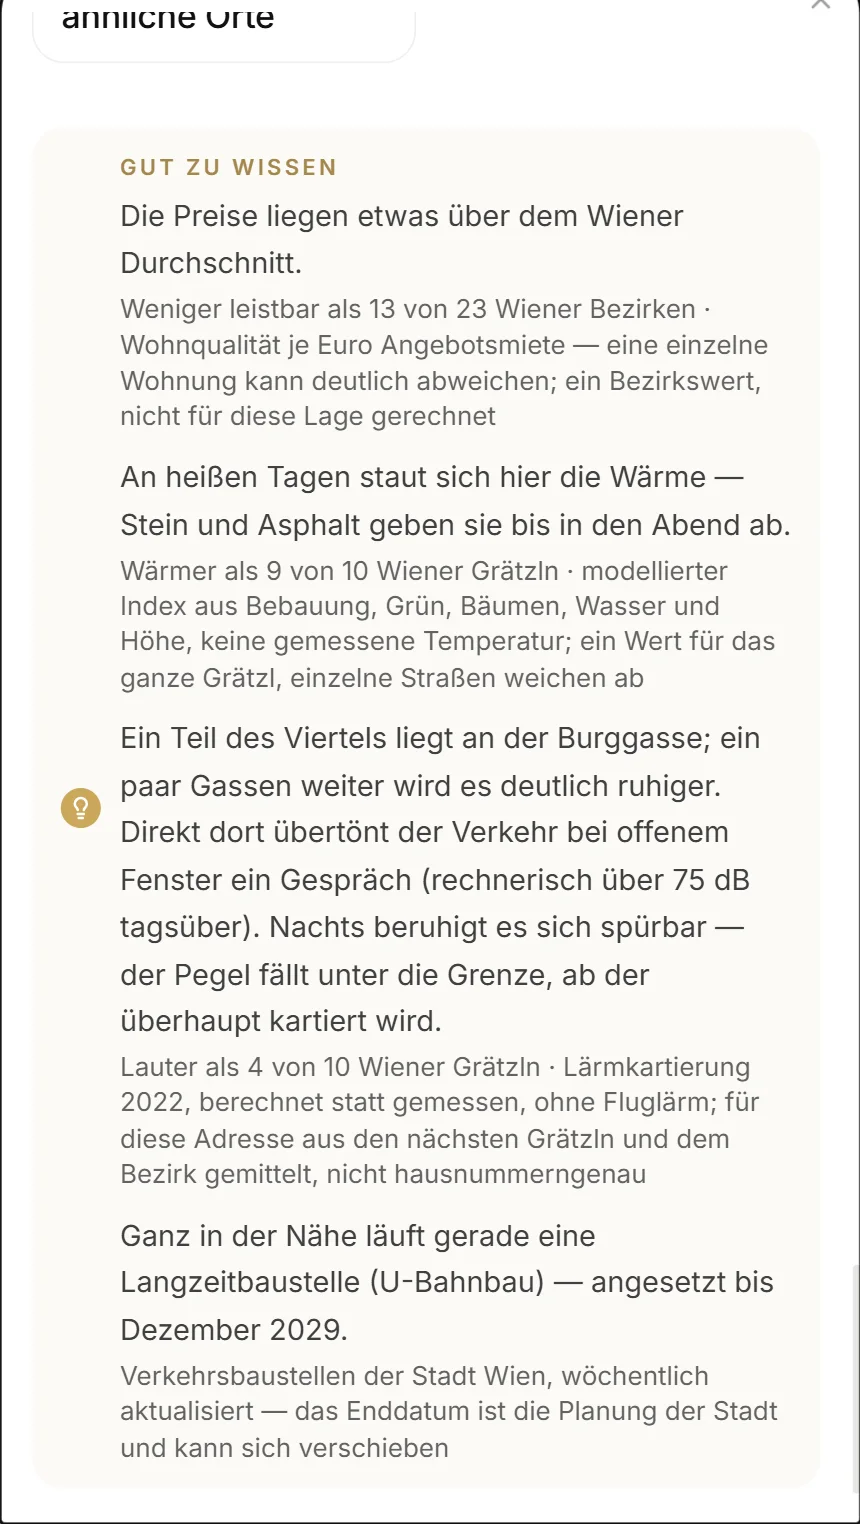
Good to know
The downside is spelled out
With context: “louder than 4 in 10 Vienna Grätzl”, “warmer than 9 in 10”. A measured downside is never removed, only explained better. In the product that is a promise, not a matter of style.
Open data · layer by layer
What makes a street lies in open data
The prototype uses eight values per place, each from one source. The product goes down to street level: surface, roof model, trees, lights, sun. Switch views.
Explained · why 0 to 10Raw data comes in different units: reports per 1,000 residents, percent park area, stops nearby. Only on one scale can they be weighted and added. Noise is inverted: a high value means quiet, so “more is better” holds everywhere.
The same city again
Every lamp where the city records it
172,296 street lights, 21,978 benches, 11,248 zebra crossings. No estimate, no random pattern: every point at its real position.
The ground is measured
Cobblestones lie where the city records them
Every surface with type, material and kerb. That becomes road, pavement and paving, instead of guessing asphalt by road class.
The method
How open data becomes a score
Collect, calculate, translate, check. Everything finite is precomputed once and stored as a static file, consistent in the PDF and in comparisons, at no running cost. AI runs at runtime only for the infinite, arbitrary addresses, and is cached.
Explained · the prototype in miniatureSeed file → SQLite → engine → API → card. The same path, just with one file instead of a data factory.
Perspectives, not filters
The same city, read differently
A perspective is just a weighting. The family puts safety and green first. At the top: Grätzl on the city edge, with forest and vineyards.
Switch perspective
Same data, different answer
Whoever wants city life weights transit, errands and urbanity. The ranking turns: MuseumsQuartier, Westbahnstraße, Schottenring. No district is objectively the best.
The engine
A formula you can check by hand
The Living Score is the weighted mean of the eight layers, scaled to 0 to 100. No machine learning, no black box. From 90 it reads Excellent, from 80 Very good, from 70 Good.
Radical honesty
Every strength has a trade-off
The engine names the strongest layers and the trade-off that really counts for the chosen perspective: the weakest layer that matters to it. No place is perfect.
For developers
One answer, four faces
Card, JSON, SQL and Python are the same answer from different angles. The frontend asks the REST API and displays, nothing more. Switch views.
Explained · why the JSON looks like thisFirst identity, then result, then evidence (dimensions with value, weight, level), finally interpretation (strengths, tradeoff). A frontend never recalculates. The prototype speaks German, so the values appear that way in the response.
Second frontend
The same in the terminal
The CLI client talks to the same API. Swapping a frontend means swapping one file.
Explained · two languages, one resultThe live card above calculates in JavaScript, the prototype in Python. Checked against the real API: 1,342 cases, all 122 places times eight perspectives plus custom weights, zero differences. Getting there was instructive: since 3.12 Python sums floats with compensation and rounds the exact binary value. Without both, Spittelberg read 79.9 instead of 80, “Good” instead of “Very good”.
Four components
Database, backend, API, frontend
For Agile Software Engineering the core is rebuilt with Python, Flask and SQLite instead of TypeScript and Cloudflare. The engine depends on neither web nor database and can be tested on its own.
Explained · how and why the data is reducedFrom Vienna Living Map the prototype takes only the eight core values per place, as a seed file. Grätzl carry five own values and inherit three from their district. That keeps every number checkable with a calculator, and the team can build and review the core in one semester.
The data model
Five tables, no personal data
A district has many places. A perspective has many weights, one per dimension. The favourites list stores only place and note, no login, no name. Foreign keys with ON DELETE CASCADE keep the database clean.
The git path
No change without a second pair of eyes
git flow: main is the submitted state, develop the current one. Every feature grows on its own branch and comes back via pull request, with a second person’s review and green tests.
CI/CD
The same idea, two sizes
For the prototype 16 lines suffice: on every push the forge runner clones the repo, installs Flask and runs the tests. As of 2 October 2026: six of six runs green. In the product the chain is longer, the principle the same: every check lives in code.
Explained · YAML, CI and CDThe YAML file tells the forge what to do after every push. CI (continuous integration): every change is checked against all tests at once, not on submission day. CD (continuous delivery): the same push triggers the deploy. The prototype has CI, deliberately without CD, so the team understands the go-live step itself.
The team · agile
Four roles, five sprints, one submission
Two-week sprints along the course units, each ending with a review and a changelog entry. A short sync per week, everything else asynchronous through issues and pull requests on the forge.
Explained · user stories“As a family I want places ranked by my priorities” → GET /ranking?persona=familie. “As a flat hunter I want my own weights” → POST /score, a sum of 0 returns 400. “I want to save places” → /favorites. Every story has its acceptance criteria as a test.
Definition of Done
Done means: checked, documented, honest
A task is only done when it meets these five points. AI help is allowed. Its share is stated per entry in the changelog, and everyone must be able to explain their own code.
Where it goes next · light
The floor lottery
You see a flat for twenty minutes, on one day, at one time. Whether any sun comes in at all in December is decided by the buildings opposite.
Move time
A day on Schrankgasse
The Azima stage builds the house with its measured neighbours. Morning, noon, evening: switch the time and watch the shadows move across the facade.
Azima
The sun in the room
This became Azima, the light check for flats. It reads the floor plan from the listing PDF, places the flat in the real building and calculates when direct sun reaches the floor. Room by room.
Calculated on your device
Sun load, no upload
The calculation runs on your own phone’s or laptop’s graphics card. The floor plan never leaves the device, and Azima says openly when the data is not enough for an answer.
Outlook: The next step calculates interior light from the floor plan. That does not exist for Vienna yet. How exactly is not revealed yet.
Azima · the light check
Measured, not estimated
The example building Schrankgasse 10 as a dollhouse: the measured house with its neighbours, the flat opened from above, the sun where it stands this minute.
Azima · the report
Everything in one PDF, room by room
At the end Azima saves the result as a report: when the sun reaches which room, on three key dates and across the year, what the building opposite blocks, what follows for shading and desk placement. Plus “On the roof”: photovoltaics from the solar register and the greenable area from the roof model.
Honestly
How stripped-down the prototype is
The prototype shows the core in about 400 lines of Python. The product behind it calculates the sun for every address in Vienna, builds an obstruction horizon from the roof model and renders the surroundings in 3D. Understand the formula, and you understand what the big version knows on top.
Principles written in code
The opposite of real-estate marketing
In Vienna Living Map these rules are build gates, not intentions. The prototype adopts the first two literally in its engine.
The bigger picture
From prototype to product
A search that understands wishes in everyday language, an atmosphere fingerprint with eight axes, the real light of every address. All free, built in Vienna, for Vienna.
Live · Azima in the listing
The light widget, just calculated in your browser
One line of code shows on any listing page how many hours of direct sun a Vienna address gets on 21 March, 21 June and 21 December, from the officially measured building heights. Below it “On the roof”: photovoltaic potential and greenable area. The card below is the real widget, not a picture of it.
<script src="https://viennalivingmap.com/einbetten.js"
        data-adresse="Schrankgasse 10, 1070 Wien"
        data-etage="3" data-partner="YOUR-KEY" data-lang="en" async></script>
<iframe src="https://viennalivingmap.com/einbetten#adresse=Schrankgasse%2010%2C%201070%20Wien&etage=3"
        title="Sun at this address" loading="lazy"
        style="width:100%;max-width:560px;height:440px;border:0"></iframe>
No cookie, no tracking: address and key sit in the frame’s fragment and never reach a server. All about the widget →
What Vienna’s open data can do too
Six stories from the same data
Next
The product behind the case study
The prototype shows the formula. Vienna Living Map shows the city, Azima the light inside the flat.
“The AI here may translate, but never decide. Ranking is done by a formula on open data — no district gets talked up.”
Prototype API
Eleven endpoints, all JSON
| GET | /api/v1/places?q=Spittelberg | Search places |
| GET | /api/v1/places/<id>?persona=familie | Score card of a place |
| GET | /api/v1/ranking?persona=urban&kind=graetzl | Ranking |
| GET | /api/v1/compare?a=<id>&b=<id> | Which place wins where? |
| POST | /api/v1/score | own weighting |
| GET · POST · PATCH · DELETE | /api/v1/favorites | Favourites |
Errors come as {"error": "…"} with 400 or 404. 16 unit tests run on every push.
Data & sources
23 districts and 99 Grätzl from Vienna Living Map, based on Vienna Open Government Data (data.wien.gv.at, CC BY 4.0), OpenStreetMap (ODbL), crime statistics, the Environment Agency and Statistics Austria. Prices are district medians. Images: score card, Azima stage and open-data graphics, Schrankgasse 10, Vienna-Neubau.
Course Agile Software Engineering, Master’s in Digital Technology & Innovation (cohort 1.28), FHWien der WKW, winter term 2026/27. Not housing advice.